 |
Fasttrack
to America's Past Teacher Key |
|
|
Fasttrack
to America's Past Teacher Key |
|
 Page 122 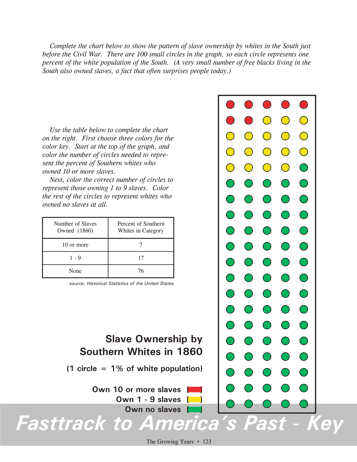 Page 123 |
Pages 122
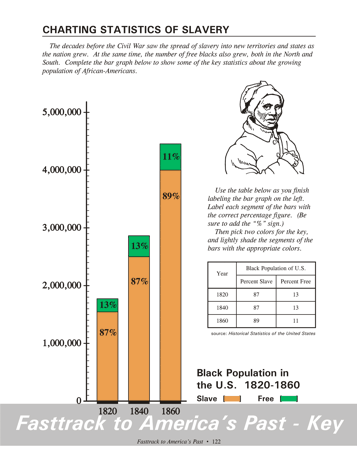
& 123 - Charting Statistics of Slavery Making the chart, page 122 Students will need a # 2 pencil and two color pencils for this bar graph. Green and orange are good choices. Students should study the table, then neatly label the segments of the bars with the correct percentage figures. Remind them to add the "%" sign. Finally, they should lightly shade the appropriate segments and the color key to graphically show the free and slave population. What the chart shows, page 122 This bar graph shows that the black
population was growing
steadily during the period from 1820 to 1860. The majority were
held
in slavery, but free black communities could be found in both the North
and the South. The drawing shows Harriet Tubman, the famous
escaped
slave who led many others to freedom. Making the chart, page 123 Students will need three color pencils to complete this chart. Red, yellow, and green are good. Each small circle represents 1 percent of the white population of the South in 1860.Students should study the table, and color the circles to show the data graphically. Color 7 circles at the top with red to represent those who owned 10 or more slaves. Use yellow to color 17 circles just under that to represent those who owned 1 to 9 slaves. Color the remaining 76 circles green to represent those who owned no slaves at all. What the chart shows, page 123 This chart often surprises students, many of whom have the impression that most Southern whites owned slaves in the years before the Civil War. The great plantations that held large numbers of slaves actually represented only a thin slice of Southern society. The largest group in the South was the small farmer who owned no slaves at all. It is certainly fair to say, however, that most whites in the South supported the system of slavery, even if they personally did not own any. A small number of free blacks also owned slaves in the decades before the Civil War. That fact often surprises students as well. |
|
Copyright Notice
Copyright 2018 by David Burns. All rights reserved. Illustrations and reading selections appearing in this work are taken from sources in the public domain and from private collections used by permission. Sources include: the Dover Pictorial Archive, the Library of Congress, The National Archives, The Hart Publishing Co., Corel Corporation and its licensors, Nova Development Corporation and its licensors, and others. Maps were created or adapted by the author using reference maps from the United States Geological Survey and Cartesia Software. Please see the home page for this title for more information. |